|
Preparing for the SAT? Claim Your Personalized Math Plan →
|
A linear function is a mathematical relationship where the output changes at a constant rate as the input increases. It is written as f(x) = mx + b, where m is the slope (rate of change) and b is the y-intercept (starting value). Its graph is always a straight line. Linear functions appear throughout Florida MAFS algebra standards and account for 4–6 questions on the SAT Math section.
A linear function is a relationship where the output changes at a constant rate as the input increases. It’s written f(x) = mx + b, where m is the slope (rate of change) and b is the y-intercept (starting value), and its graph is always a straight line.
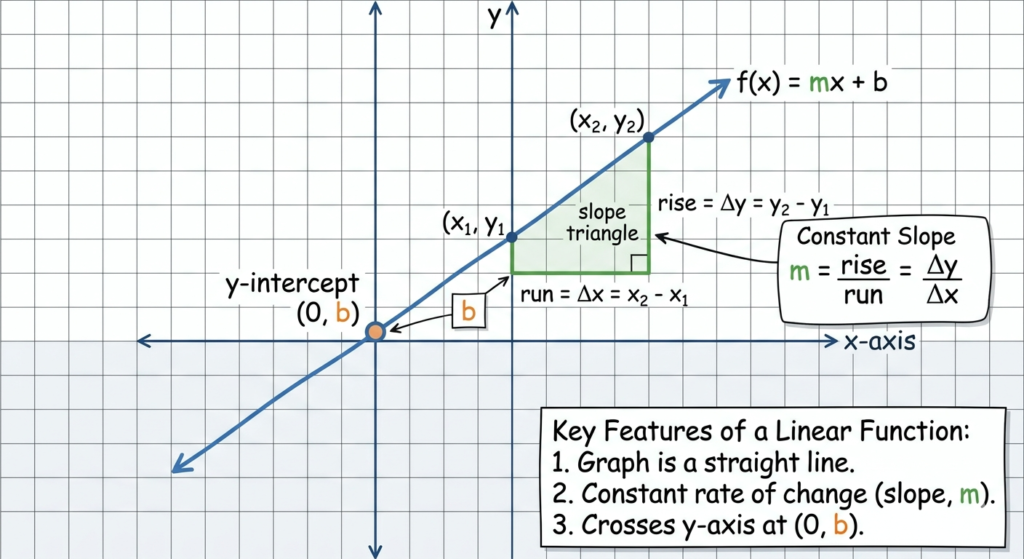
A function whose graph is a straight line, meaning the rate of change between any two points is constant. In function notation it’s f(x) = mx + b, where m is the slope (rate of change) and b is the y-intercept (where the line crosses the y-axis). Every linear function produces a straight-line graph.
The rate of change — the x-coefficient. m > 0 rises, m < 0 falls, m = 0 is horizontal. As a fraction: rise ÷ run.
The constant term — where the line crosses the y-axis, the point (0, b). The "starting value" in word problems.
Most common — graph and read slope/intercept directly. e.g. f(x) = 3x - 2 → slope 3, y-intercept -2.
Common on tests. Convert: y = (-A/B)x + C/B, so slope = -A/B. e.g. 2x + 4y = 8 → y = -½x + 2.
Use when you know slope and one point but not b. e.g. m = 2, (3,5) → y = 2x - 1.
SAT/EOC efficiency rule: identify the form, then extract m and b immediately. Slope-intercept → m is the x-coefficient, b the constant. Standard → slope = -A/B. Two points → m = (y₂-y₁)/(x₂-x₁), then substitute into y = mx + b. These patterns solve most SAT linear questions in under 60 seconds.
The single most-tested topic in “Heart of Algebra”, 4–6 questions per exam. The k-constant example above is one of the most commonly missed types.
| SAT MATH CATEGORY | HOW LINEAR FUNCTIONS APPEAR | FREQUENCY |
|---|---|---|
| Heart of Algebra | Write a linear function from two points; identify slope & y-intercept from f(x) = mx + b | 2–3 per test |
| Word Problems | Interpret slope as rate of change; b as initial value; evaluate f(x) for a given x | 1–2 per test |
| Data Analysis | Identify a linear function from a table (constant rate); line of best fit | 1–2 per test |
| Linear Systems | Solve where two lines intersect; number of solutions from slope comparison | 1 per test |

The line rises from left to right. f(x) = 3x + 1 Models growth: earnings over time, distance at constant speed, savings at a fixed rate.
The line falls from left to right. f(x) = -2x + 5 On the SAT: depreciation, temperature drop, remaining balance.
A horizontal line — the output is the same for every input. f(x) = 4 On the SAT, a constant function always has slope 0.
Linear only if the rate of change is constant. Test: equal y-differences for equal x-differences → linear. Varying differences → non-linear (quadratic, exponential).
Reading f(x) = 3x + 5 as "slope 5, intercept 3." The x-coefficient is always the slope (m = 3); the constant is the y-intercept (b = 5).
Fix: circle the x-coefficient and label it it m first.
f(x) = mx + b is the same equation as y = mx + b — f(x) only emphasizes that y depends on x.
Fix: rewrite f(x) as y until the equivalence is automatic.
Applying f(x) = mx + b to data that's actually quadratic or exponential.
Fix: confirm y-differences are constant for equal x-differences before assuming linear.
With point (3, -2): y - (-2) becomes y - 2 instead of y + 2 (missing the double-negative).
Fix: write the full y - y₁ = m(x - x₁) with parentheses before simplifying.
To graph f(x) = mx + b on a coordinate plane, follow these five steps (example: f(x) = 2x + 3).
Plot (0, b) where the line crosses the y-axis. For f(x) = 2x + 3, plot (0, 3).
The x-coefficient, written as rise/run. For 2x + 3, m = 2 = 2/1 (rise 2, run 1).
From the y-intercept, move up by the rise and right by the run: from (0, 3) → (1, 5).
Repeat the slope move: from (1, 5) → (2, 7). If all three are collinear, the slope is correct.
Extend through all points with arrows both ways — a linear function extends infinitely. Label it f(x) = 2x + 3.
Graphing from standard form (Ax + By = C): first convert to slope-intercept by solving for y, then follow steps 1–5. e.g. 3x + y = 6 → y = -3x + 6 → f(x) = -3x + 6.
A function of the form f(x) = mx + b, where m is the slope (rate of change) and b is the y-intercept. Its graph is always a straight line, defined by a constant rate of change — for every equal increase in x, y increases by the same amount. It appears throughout Florida MAFS algebra standards, specifically MAFS.8.F.A.3.
They're identical: f(x) = mx + b is mathematically equivalent to y = mx + b. The notation f(x) ("f of x") emphasizes that y is a function of x — every x input produces exactly one y output. The f(x) notation becomes essential when multiple functions g(x), h(x) appear together, but for linear functions they're interchangeable.
A function is linear if the rate of change between any two rows is constant. Calculate Δy and Δx between consecutive rows; if Δy/Δx is the same for every pair, it's linear and the slope is m = Δy/Δx. If the ratios differ, it's non-linear. This table test appears directly on SAT data-analysis questions.
Slope is part of every linear function, the m in f(x) = mx + b. Systems of equations are two linear functions graphed at once; their intersection is the solution. Same slope but different intercepts → parallel (no solution); identical functions → infinite solutions. See our slope guide for the full definition and formula.
Yes, f(x) = mx + b, graphing from slope-intercept and standard form, writing equations from two points or a point and slope, identifying linear vs. non-linear from tables, and the SAT question types students miss most. Our diagnostic-first approach finds exactly which problems cost points before building a targeted plan. Book a free math assessment to start.
Book a free math assessment and get a personalized Digital SAT plan built around your gaps.