|
Preparing for the SAT? Claim Your Personalized Math Plan →
|
Mathematical modeling in math is the process of using equations and functions to represent and predict real-world situations. The four main types of mathematical models are: linear (y = mx + b, constant rate of change), quadratic (y = ax² + bx + c, projectile motion and optimization), exponential (y = a·bˣ, growth and decay), and statistical (line of best fit, scatter plot regression). Mathematical modeling appears across all three SAT Math content areas and in Florida’s MAFS.912.F-LE standards.
An equation that represents a situation.
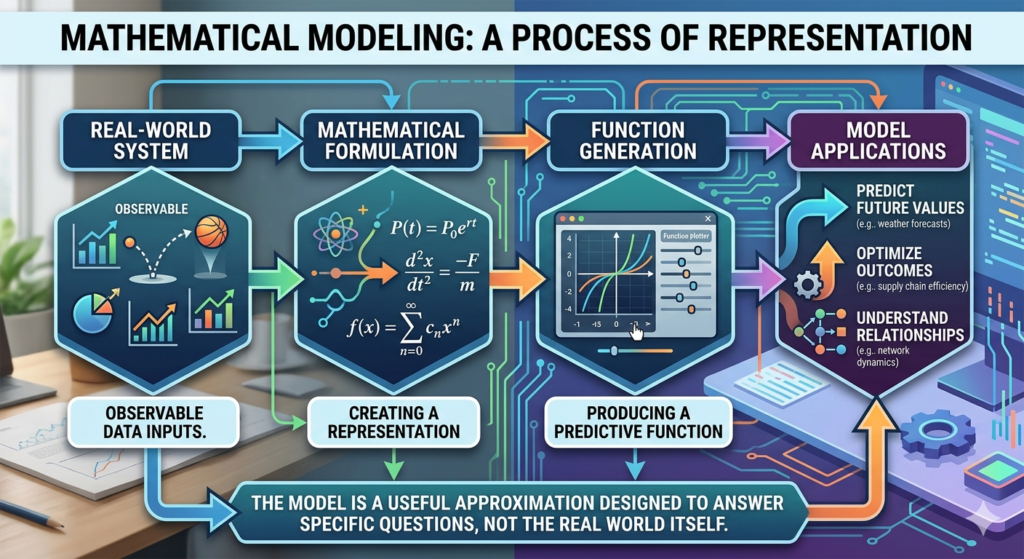
Formal definition: Mathematical modeling is the process of creating a mathematical representation — an equation, formula, or function — that describes the behavior of a real-world system or situation. A mathematical model takes observable data as input and produces a function that can be used to predict future values, optimize outcomes, or understand relationships between variables. The model is not the real world itself — it is a useful approximation designed to answer a specific question.
Use when: data increases or decreases at a constant rate. The slope m is the rate of change; b is the starting value.
Real-world: hourly wages, distance at constant speed, cost per item.
Data tell-tale: equal changes in x produce equal changes in y. Graph: straight line.
Use when: data rises then falls (or falls then rises) – a parabolic shape. The vertex is the maximum or minimum value.
Real-world: projectile height, area problems, revenue optimization (price × quantity).
Data tell-tale: rate of change itself is changing at a constant rate. Graph: parabola.
Use when: data grows or decays at a percentage rate – multiplied by the same factor each period. a = initial value; b = growth factor (b > 1 = growth; 0 < b < 1 = decay).
Real-world: population growth, compound interest, radioactive decay, viral spread.
Data tell-tale: equal changes in x produce equal ratios in y.
Use when: you have real data with scatter – no perfect formula, but a trend exists. The line of best fit minimizes total distance from all data points.
Real-world: predicting test scores from hours studied, sales forecasting, climate data.
Data tell-tale: scatter plot with an approximate linear or nonlinear trend. Given on SAT Math – read the slope and intercept from the graph.
A student earns $12.50 per hour at a part-time job. Write a linear model for total earnings y after x hours, and predict earnings after a 6-hour shift.
A town has a population of 8,000. The population grows at 3% per year. Write an exponential model for population P after t years, and predict the population after 10 years.
A ticket vendor charges $p per ticket and sells (200 – 4p) tickets at that price. Write a quadratic model for revenue R in terms of p, identify the price that maximizes revenue, and find the maximum revenue.
| SAT Math Domain | Model Type Tested | % of SAT Math | Key Skill |
|---|---|---|---|
| Problem Solving & Data Analysis | Linear, Exponential, Statistical | ≈ 17% | Identify model from data table or graph, interpret slope/intercept in context |
| Heart of Algebra | Linear only | ≈ 33% | Write linear models from word problems, solve for variable in context |
| Passport to Advanced Math | Quadratic, Exponential | ≈ 28% | Quadratic optimization (vertex), exponential growth/decay, model selection |
| Additional Topics | Geometric scaling models | ≈ 7% | Area/volume scaling — relates to the /vocab/scaling/ Silo 4 page |
Identify exactly what you are trying to predict or optimize. Good modeling starts with a precise question: "What will the population be in 10 years?" or "What price maximizes revenue?" A vague question produces a vague model. On SAT Math, the question is always stated explicitly — read the last sentence of the problem before selecting a model type.
Determine which quantity is the input (independent variable, x) and which is the output (dependent variable, y). In real-world problems, the independent variable is usually time or a controllable quantity (price, hours, units). Collect or read data points from a table or graph. On SAT Math, the data is provided — your job is to read it correctly and identify the variable relationship.
Examine the data pattern to select the correct model type. Constant differences in y-values → linear model. Constant ratios in y-values → exponential model. Data rises then falls (or falls then rises) → quadratic model. Scattered data with a trend → statistical model (line of best fit). Then substitute known values to find the formula's constants (m and b for linear; a and b for exponential; a, b, c for quadratic).
Substitute the input value (x) into the formula to predict the output (y). On SAT Math, this step is straightforward arithmetic once the correct formula is written — the difficulty is Steps 1–3. Always carry units through the calculation: if x is in years and y is in thousands of people, the answer is in thousands of people.
Does the answer make sense in the real-world context? A population model that predicts a negative population is invalid — check the domain. A revenue model that gives maximum revenue at a negative price is invalid — the vertex is outside the feasible range. On SAT Math, "interpret in context" questions ask: "What does the y-intercept represent?" or "What does the slope mean in this situation?" — always answer in the units of the original problem.
C = 1.80m + 2.50. C = 1.80(7) + 2.50 = 12.60 + 2.50 = $15.10. Slope = $1.80/mile (rate of change). Y-intercept = $2.50 (base fare when m = 0).
Doubling every 4 hours → b = 2 per 4-hour period. Rewrite: P = 500 · 2^(t/4). At t = 12: P = 500 · 2^(12/4) = 500 · 2³ = 500 · 8 = 4,000 cells. SAT note: the exponent is t/4, not t — the doubling period must appear in the exponent denominator.
Maximum height at vertex: t = −b/(2a) = −80/(2·(−16)) = −80/(−32) = 2.5 seconds. Maximum height: h = −16(2.5)² + 80(2.5) + 6 = −16(6.25) + 200 + 6 = −100 + 200 + 6 = 106 feet. The ball reaches its maximum height of 106 feet at t = 2.5 seconds.
Slope = 6: for each additional hour studied, the predicted test score increases by 6 points. Prediction: y = 6(5) + 52 = 30 + 52 = 82. Interpret: a student who studies 5 hours is predicted to score 82. Y-intercept = 52: the model predicts a score of 52 for 0 hours of study (baseline score without studying).
Mathematical modeling in math is the process of creating an equation or function that represents a real-world situation, allowing you to predict values or optimize outcomes. The four main types of mathematical models used in high-school math are linear (y = mx + b), quadratic (y = ax² + bx + c), exponential (y = a·bˣ), and statistical (line of best fit). Mathematical modeling is tested across all three SAT Math content areas and is covered in Florida’s MAFS.912.F-LE and MAFS.912.S-ID standards.
The four main types of mathematical models in high-school math are: (1) Linear models (y = mx + b) — used when data changes at a constant rate; (2) Quadratic models (y = ax² + bx + c) — used for data that rises and falls, such as projectile motion or revenue optimization; (3) Exponential models (y = a·bˣ) — used for percentage growth or decay, such as population growth or compound interest; (4) Statistical models (line of best fit) — used for real-world scatter data where no perfect formula exists but a trend can be fitted. Identifying the correct model type is the most commonly tested modeling skill on the SAT Math section.
To identify the correct mathematical model type, examine the data pattern: if consecutive y-values have a constant difference, use a linear model (y = mx + b). If consecutive y-values have a constant ratio (each multiplied by the same factor), use an exponential model (y = a·bˣ). If the data rises then falls (or forms a parabolic shape), use a quadratic model (y = ax² + bx + c). If you have scattered real-world data with an approximate trend, use a statistical model (line of best fit). On the SAT Math section, checking for constant differences vs constant ratios in a data table is the fastest model-identification method.
Mathematical modeling appears across all three SAT Math content areas. In Problem Solving and Data Analysis (≈17% of the exam), modeling questions ask students to interpret linear and exponential models from tables or graphs, and to identify slope and y-intercept in real-world context. In Heart of Algebra (≈33%), students write linear models from word problems and solve for variables in context. In Passport to Advanced Math (≈28%), students work with quadratic and exponential models, including optimization using the vertex formula. Together, mathematical modeling questions account for over half of all SAT Math points. See the SAT Math content specification on College Board for the full domain breakdown.
Yes. InLighten’s certified math tutors in Orlando specialize in mathematical modeling for both Florida FSA/EOC assessments and SAT/ACT Math preparation — covering all four model types (linear, quadratic, exponential, and statistical), the model-identification process, and the specific SAT question formats that test modeling in each content domain. Student-athletes working toward Florida Bright Futures Scholarship score requirements (minimum SAT 1010–1290 depending on tier) or NCAA academic clearinghouse eligibility receive priority alignment sessions focused on the highest-leverage math skill gaps. Mathematical modeling is consistently among the fastest topics to improve under targeted tutoring — pattern recognition, not calculation speed, is what the SAT tests.