
|
Preparing for the SAT? Claim Your Personalized Math Plan →
|
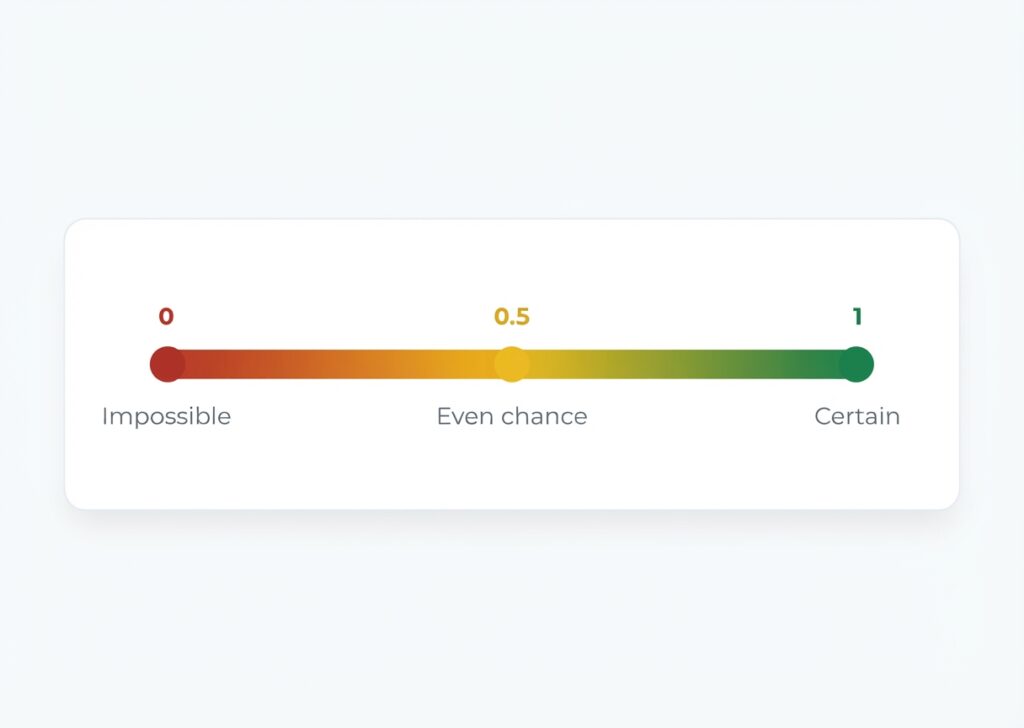
In mathematics, probability is a measure of how likely an event is to occur, expressed as a number between 0 (impossible) and 1 (certain). The basic probability formula is: P(A) = number of favorable outcomes ÷ total number of possible outcomes. To calculate probability, count how many outcomes satisfy your event, then divide by all possible outcomes. Probability appears on the SAT Math and ACT Math sections and in Florida’s MAFS.912.S-CP standards.
Probability is a measure of how likely an event is to occur, expressed as a number between 0 (impossible) and 1 (certain). The basic formula is P(A) = favorable outcomes ÷ total outcomes. Tested on the SAT and ACT under “Problem Solving and Data Analysis” and in Florida’s MAFS.912.S-CP standards.
Probability quantifies the likelihood of an event occurring, expressed as a number between 0 and 1, where 0 means impossible and 1 means certain. An event with probability 0.5 is equally likely to occur or not. Probability is the foundation of statistics, data analysis, and decision-making under uncertainty.
The basic formula: count the outcomes that satisfy your event, then divide by all possible outcomes.
Every probability problem uses one of four formulas. On the SAT, choosing the right formula is the skill being tested, not the arithmetic.
The most common SAT probability error is picking the wrong operation. Here’s the logic that keeps them straight.
Theoretical is what should happen in ideal conditions; experimental is what actually happened in trials. As trials increase, experimental approaches theoretical (Law of Large Numbers).
| THEORETICAL | EXPERIMENTAL | |
|---|---|---|
| Definition | What should happen (equally likely outcomes) | What actually happened (trials/data) |
| Formula | favorable ÷ total | times A occurred ÷ total trials |
| Example | Fair coin: P(heads) = 1/2 = 0.5 | 100 flips, 53 heads → 0.53 |
| When to use | Ideal conditions, dice/coins/spinners | Real data, surveys, simulations |
| FSA connection | Constructed problems (dice, cards) | Data analysis (tables, survey results) |
Probability falls under “Problem Solving and Data Analysis” about 17% of SAT Math. Students who can’t quickly identify basic, compound, and conditional types lose 2–3 questions per test.
| QUESTION TYPE | SAT FREQ | ACT FREQ | FORMULA |
|---|---|---|---|
| Basic (from a table/graph) | 1–2 per test | 2–3 per test | favorable ÷ total |
| Compound (independent) | 1 per test | 1–2 per test | P(A) × P(B) |
| Conditional ("given that") | 1 per test | 1 per test | P(A and B) ÷ P(A) |
| Mutually exclusive / OR | Occasionally | 1 per test | P(A) + P(B) − P(A ∩ B) |
Work each one, then reveal the answer to check yourself.
Book a free math assessment and get a personalized Digital SAT plan built around your gaps.