|
Preparing for the SAT? Claim Your Personalized Math Plan →
|
Statistics in math is the study of collecting, organizing, and interpreting numerical data. In high-school math, descriptive statistics covers four key measures: mean (average: sum ÷ count), median (middle value when ordered), mode (most frequent value), and range (maximum − minimum). Standard deviation measures how spread out the data is from the mean. These statistics appear on Florida FSA assessments and the SAT Math “Problem Solving and Data Analysis” section.
Sum/number of items.
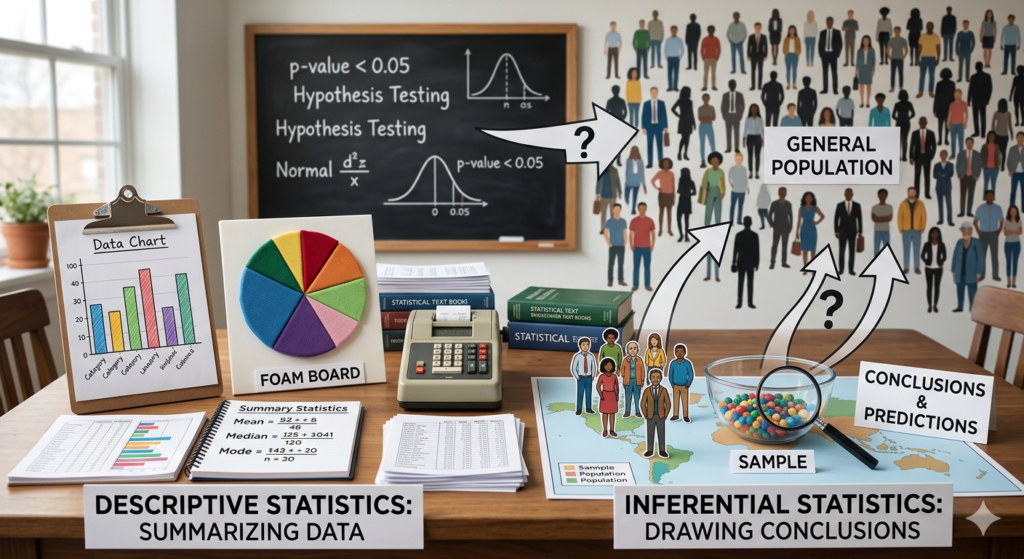
Formal definition: Statistics in mathematics is the discipline concerned with collecting, organizing, summarizing, and interpreting data. Statistical methods allow us to describe patterns in data, compare groups, and draw conclusions from numerical information. Statistics is divided into two main branches: descriptive statistics (summarizing the data you have) and inferential statistics (drawing conclusions about a larger population from a sample).
Sum all values (Σx) then divide by count (n).
Example: Data: 4, 7, 7, 9, 13 → Sum = 40 → Mean = 40 ÷ 5 = 8
Sensitive to outliers – one extreme value pulls the mean toward it. The most common measure of center on SAT Math.
Step 1: Order the data from smallest to largest.
Step 2: Find the middle value.
Odd count: middle value. Even count: average of two middle values.
Example: 4, 7, 7, 9, 13 → Median = 7 (3rd of 5 values)
Resistant to outliers – more reliable center for skewed data.
The mode is the value with the highest frequency in the data set.
Example: 4, 7, 7, 9, 13 → Mode = 7 (appears twice)
Edge cases: No mode (all values appear once). Bimodal (two values tied for most frequent). Can have more than two modes.
The simplest measure of spread – the total span from smallest to largest value.
Example: 4, 7, 7, 9, 13 → Range = 13 - 4 = 9
Limitation: Range is affected by outliers. The IQR (interquartile range = Q3 - Q1) is the outlier-resistant version of range tested on Florida FSA.
Standard deviation tells you how tightly the data clusters around the mean. High σ = data is spread out. Low σ = data is clustered near the mean.
On SAT Math, you compare standard deviations – you do NOT manually calculate them. "Which data set has greater variability?" is the standard SAT question format.
| SAT QUESTION TYPE | WHAT IT TESTS | MOST COMMON ERROR |
|---|---|---|
| Calculate mean from a table | Apply x̄ = Σx ÷ n to frequency-weighted data | Not weighting by frequency — treating all values equally |
| Median from ordered list or table | Find middle value; handle even vs odd counts | Forgetting to order data before finding the middle |
| Outlier effect on mean vs median | Which measure changes more when an extreme value is added? | Saying both change equally — mean is far more affected |
| Compare standard deviations | Which data set has more spread? No calculation required. | Trying to calculate σ manually instead of comparing spread visually |
| Interpret data from histogram/box plot | Identify shape (skewed/normal), center, and spread from a graph | Misreading skew direction; confusing mean and median on skewed graphs |
| DESCRIPTIVE STATISTICS | INFERENTIAL STATISTICS | |
|---|---|---|
| Purpose | Summarize and describe the data you have | Draw conclusions about a larger population from a sample |
| Examples | The average test score in your class is 78. The range is 42 points. | Based on this sample, we estimate that 60% of Florida students prefer online tutoring. |
| Key tools | Mean, median, mode, range, standard deviation, histograms, box plots | Hypothesis testing, confidence intervals, p-values, sampling distributions |
| High school scope | Grades 9–12 • Florida FSA • SAT Math Problem Solving & Data Analysis | AP Statistics • College-level • Not on standard Florida FSA |
In a normal distribution, the data is symmetric around the center — the mean, median, and mode are all equal and located at the peak of the bell curve. Most data points cluster near the mean, with progressively fewer values farther away. Normal distributions appear on SAT Math questions about histograms and are the assumed shape for standard deviation interpretation questions.
A right-skewed distribution has a long tail extending to the right — a few high outliers pull the data in that direction. When data is right-skewed: mean > median > mode. The mean is pulled right (toward the outliers) while the median stays near the center of most of the data. Example: household income data is typically right-skewed (a few very high earners pull the mean up). On SAT: "In a right-skewed distribution, which is greater — the mean or the median?" → Mean.
A left-skewed distribution has a long tail extending to the left — a few low outliers pull the data in that direction. When data is left-skewed: mean < median < mode. The mean is pulled left (toward the low outliers) while the median stays closer to where most data is. Example: retirement age data — most people retire around 65, but a few retire very early, creating a left-skewed distribution. The SAT question format: "A histogram shows left-skewed data. What can you conclude about the relationship between mean and median?" → Mean < median.
Order: 3, 4, 5, 8, 8, 8, 10. Mean = (3+4+5+8+8+8+10)÷7 = 46÷7 ≈ 6.57. Median = 4th value = 8. Mode = 8 (appears 3 times). Range = 10 − 3 = 7.
Mean (50) > Median (38). This means the distribution is right-skewed — a few high values are pulling the mean to the right, above the median. The tail extends to the right. Most of the data is concentrated below 50.
Both means: Class 1 = (82+84+86+88+90)÷5 = 430÷5 = 86. Class 2 = (60+75+86+97+112)÷5 = 430÷5 = 86. Same mean confirmed. Class 2 has greater standard deviation — the values spread from 60 to 112 (range = 52), much wider than Class 1 (range = 8). Greater spread around the same mean = greater standard deviation. No calculation required.
The mean changes more. Adding 40 (an outlier, much higher than the current mean of 12) will pull the mean significantly upward. New sum = (12 × 6) + 40 = 72 + 40 = 112. New mean = 112 ÷ 7 = 16. The median of 7 values is the 4th value after ordering — adding one high value shifts the median by at most one position, a much smaller change. Mean is sensitive to outliers; median is resistant.
Mean, median, and mode are the three measures of central tendency in statistics. The mean is the arithmetic average: add all values and divide by the count (x̄ = Σx ÷ n). The median is the middle value when data is ordered from smallest to largest — for an even count, it is the average of the two middle values. The mode is the value that appears most frequently — a data set can have no mode (all values appear once), one mode, or multiple modes (bimodal or multimodal). For data sets with outliers, the median is a more reliable measure of center than the mean.
Mean formula: x̄ = Σx ÷ n (sum of all values divided by the count of values). Median formula: order the data set from smallest to largest, then find the middle value. For an odd number of values, the median is the single middle value. For an even number of values, the median is the average of the two middle values. Mode: no formula — the mode is simply the value that appears most often in the data set. There is no calculation; count how many times each value appears and identify the most frequent one.
An outlier (an extreme value much higher or lower than the rest of the data) has a large effect on the mean but little effect on the median and almost no effect on the mode. The mean is pulled toward the outlier because it includes every value in its calculation — one extreme value changes the sum significantly. The median is resistant to outliers because it depends only on the middle position, not the actual values at the extremes. The mode is unaffected unless the outlier happens to repeat. On the SAT Math section, “which measure best represents the typical value?” questions expect the answer: median, when the data contains an outlier or is skewed. See Florida’s MAFS.912.S-ID.3 standard for the full curriculum context.
Standard deviation (σ) measures how spread out the data values are around the mean. A low standard deviation means the data points cluster closely around the mean — the values are consistent. A high standard deviation means the data is spread over a wide range — the values vary significantly. On the SAT Math section, you are never asked to manually calculate standard deviation from a data set. Instead, you compare standard deviations between two data sets: the data set with values farther from the mean always has the greater standard deviation. See the SAT Math “Problem Solving and Data Analysis” specification on College Board for the full content breakdown.
Yes. InLighten’s certified math tutors in Orlando specialize in statistics for both Florida FSA/EOC assessments and SAT/ACT Math preparation — covering all five descriptive statistics measures (mean, median, mode, range, and standard deviation interpretation), outlier effects, data distribution shapes, and the specific question formats in the SAT Math “Problem Solving and Data Analysis” section. For Florida student-athletes working toward Bright Futures Scholarship score requirements (minimum SAT 1010–1290 depending on scholarship tier) or NCAA academic clearinghouse eligibility, statistics is consistently among the fastest topics to improve under targeted tutoring. We diagnose exactly which statistics concept is causing point loss before building a focused session plan.