
|
Preparing for the SAT? Claim Your Personalized Math Plan →
|
Mathematical modeling in math is the process of using equations and functions to represent and predict real-world situations. The four main types of mathematical models are: linear (y = mx + b, constant rate of change), quadratic (y = ax² + bx + c, projectile motion and optimization), exponential (y = a·bˣ, growth and decay), and statistical (line of best fit, scatter plot regression). Mathematical modeling appears across all three SAT Math content areas and in Florida’s MAFS.912.F-LE standards.
Mathematical modeling is the process of using equations and functions to represent and predict real-world situations. The four main types, linear (y = mx + b), quadratic (y = ax² + bx + c), exponential (y = a·bˣ), and statistical (line of best fit), appear across all three SAT Math content areas and in Florida’s MAFS.912.F-LE standards.
Mathematical modeling is the process of creating a mathematical representation,an equation, formula, or function, that describes a real-world system. A model takes observable data as input and produces a function that predicts future values, optimizes outcomes, or reveals relationships between variables. Crucially, the model is not the real world itself, it’s a useful approximation designed to answer one specific question.
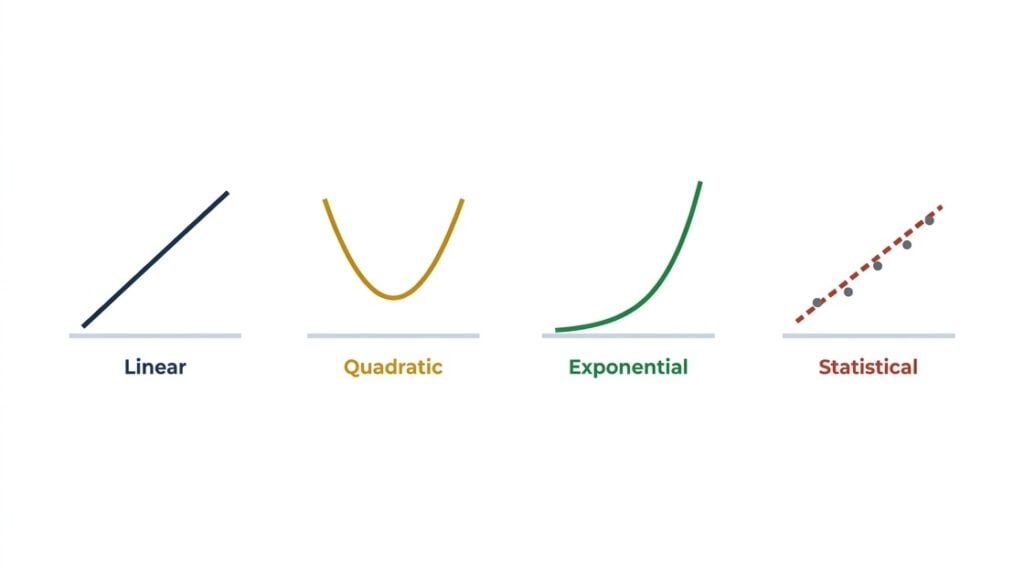
Why it's different: most vocab pages define one formula. Modeling is a process choose the right function type (linear, quadratic, exponential, or statistical), fit it to data, and interpret the result in context. It's the single most heavily weighted skill category on SAT Math.
Every modeling problem needs three decisions: identify the model type from the data, write the formula, and fit the constants. The #1 SAT error is choosing the wrong type, so learn each one’s tell-tale data pattern.
Use when data changes at a constant rate. m = rate of change; b = starting value.
Real-world: hourly wages, distance at constant speed, cost per item.
Tell-tale: equal changes in x → equal changes in y. Graph: straight line.
Use when data rises then falls (parabola). The vertex is the max or min.
Real-world: projectile height, area problems, revenue optimization.
Tell-tale: the rate of change itself changes at a constant rate. Graph: parabola.
Use for a percentage rate multiplied by the same factor each period. a = initial; b > 1 growth, 0 < b < 1 decay.
Real-world: population, compound interest, radioactive decay, viral spread.
Tell-tale: equal changes in x → equal ratios in y.
Use for real data with scatter no perfect formula, but a trend. The line of best fit minimizes total distance from all points.
Real-world: test scores vs hours studied, sales forecasting, climate data.
Tell-tale: scatter plot with a trend. On SAT: read slope and intercept from the graph.
SAT trap: adding 3% of 8,000 ten times (linear thinking) gives 10,400 — wrong. Exponential growth compounds → 10,751.
SAT insight: the vertex p = -b/2a gives the optimum price; substitute back for the max revenue. Most questions want the y-value (revenue), not the x-value (price).
Identify exactly what you're predicting or optimizing. On SAT Math, read the last sentence of the problem first, since the question is always stated explicitly.
Determine the input (independent, x) and output (dependent, y). Usually x is time or a controllable quantity. On SAT, the data is given, so read it correctly.
Constant differences → linear. Constant ratios → exponential. Rises then falls → quadratic. Scatter with a trend → statistical. Then substitute to find the constants.
Substitute the input (x) to predict the output (y). Once the right formula is written, this is just arithmetic, so always carry units through.
Does the answer make sense in context? A negative population or a max at a negative price is invalid, so check the domain. "Interpret in context" questions want the answer in the original units.
Modeling is unique, it appears in every content domain of the SAT. A student who can’t identify the model type loses points across all three scoring areas at once. No other single skill affects as many SAT Math points.
| SAT Math Domain | Model Type Tested | % of Math | Key Skill |
|---|---|---|---|
| Problem Solving & Data Analysis | Linear, Exponential, Statistical | ≈17% | Identify model from a table/graph; interpret slope & intercept in context |
| Heart of Algebra | Linear only | ≈33% | Write linear models from word problems; solve for a variable in context |
| Passport to Advanced Math | Quadratic, Exponential | ≈28% | Quadratic optimization (vertex), exponential growth/decay, model selection |
| Additional Topics | Geometric scaling models | ≈7% | Area/volume scaling; see the Scaling vocab page |
Seeing data "going up" and writing y = mx + b without checking whether differences or ratios are constant.
Fix: subtract consecutive y-values (constant difference = linear) OR divide them (constant ratio = exponential). One check settles it.
Reading "3% growth" and writing (0.03)t instead of (1.03)t. A base of 0.03 decays to near zero.
Fix: growth factor b = 1 + rate. 3% growth → 1.03; 15% decay → 1 − 0.15 = 0.85.
Finding p = −b/2a correctly, then stopping, reporting the optimal input instead of the max/min output.
Fix: substitute the vertex x back into the formula for the y-value. Most questions want the maximum revenue, not the price.
Reporting "the slope is 2.5" with no real-world meaning.
Fix: "for each additional [x-unit], [y] increases by [slope] [y-units]." That sentence is the SAT interpretation answer.
Work each one, then reveal the answer to check yourself.
A taxi charges $2.50 base plus $1.80 per mile. Write a linear model for cost C in terms of miles m, and find the cost of a 7-mile ride.
A culture starts with 500 cells and doubles every 4 hours. Write an exponential model for P after t hours, and find P at 12 hours.
A ball's height is h = −16t2 + 80t + 6. Find the maximum height and when it occurs.
A best-fit line is y = 6x + 52 (x = hours studied, y = test score). What does the slope mean, and the predicted score for 5 hours?
Modeling is the highest-leverage SAT Math skill, and the fastest to improve. Book a free math assessment and get a personalized Digital SAT plan.