
The margin of error is a statistic that expresses how much a survey or sample result may differ from the true population value, written as ± a number (for example, “52% ± 3%”). It is calculated using the formula ME = z* × (σ / √n), where z* is the critical value for the chosen confidence level, σ is the population standard deviation, and n is the sample size. A larger sample size produces a smaller margin of error. Margin of error appears in Florida’s MAFS.912.S-IC standards and on the SAT Math section under Data Analysis.
The margin of error expresses how much a survey or sample result may differ from the true population value, written as ± a number (for example, “52% ± 3%”). It’s calculated with ME = z* × (σ / √n) — where z* is the confidence-level critical value, σ the standard deviation, and n the sample size. A larger sample produces a smaller margin of error.
We are currently recording a detailed video explanation for this lesson. Check back soon or book a tutoring session for live instruction.
The margin of error measures the uncertainty in a statistical estimate. When a sample is used to draw conclusions about a population, it describes the range within which the true value is expected to fall, expressed as ± a value around the sample result. If a poll reports “54% ± 3%,” the true support level is estimated to lie between 51% and 57%.
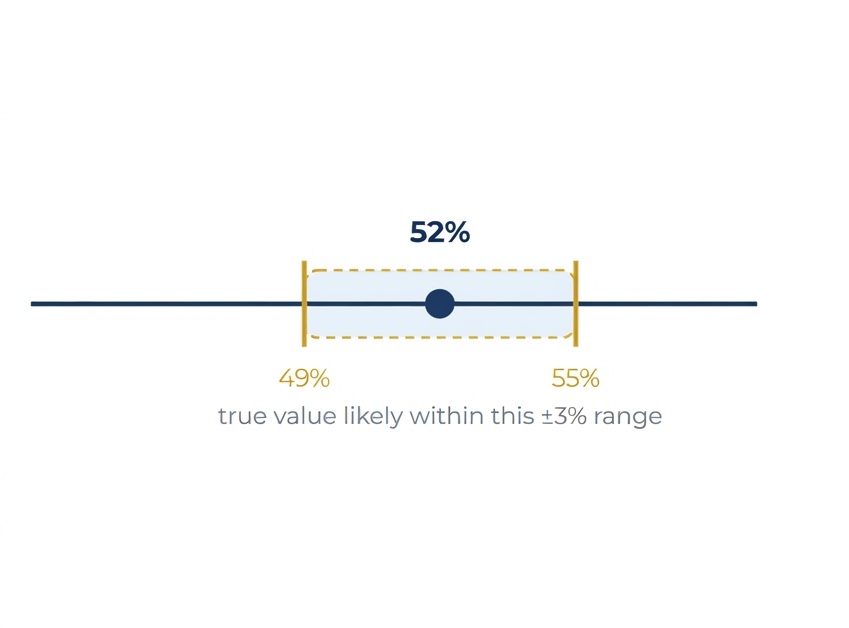
Read it as a range, not a point: a margin of error turns a single sample number into an interval. The SAT's favorite question is simply whether a given value falls inside or outside that ± range.
The formula uses three inputs: the confidence level (as a z-score), the population standard deviation, and the sample size. Know what each does before you calculate.
Key rule: as n increases, ME decreases: larger samples give more precise estimates. Because n sits under a square root, halving ME requires quadrupling n.
The confidence level sets which z-score goes in the formula. On the SAT it’s stated in the problem and it’s almost always 95%.
Narrowest interval · less certainty. Used in AP Statistics and ACT Math problems.
The most common level: used in most polling and research, and nearly all SAT margin-of-error questions.
Widest interval · highest certainty. Used in medical, scientific, and research contexts where error is costly.
ME ≈ ±4.9% → true support between 49.1% and 58.9%
At least 1,537: halving ME requires quadrupling n
The "quadruple n to halve ME" relationship comes straight from the √n in the denominator, a favorite SAT and AP Statistics concept.
No: 55% is inconsistent with the survey at 90% confidence
SAT insight: answer in terms of "consistent / inconsistent with the data," never "true / false." The skill is checking whether a value lands inside the ± range.
These questions test whether students can interpret survey data, identify what a margin of error means, and judge whether a specific value is consistent with reported results.
| SAT QUESTION TYPE | WHAT IT TESTS | FREQUENCY |
|---|---|---|
| Interval interpretation | Given "X% ± Y%," is a value inside or outside the interval? | 2–3× per test |
| Margin of error meaning | What the ± value represents (uncertainty, precision, range) | 1–2× per test |
| Sample size effect | How changing n affects ME: larger sample = smaller ME | 1× per test |
| Conclusion validity | Is a stated conclusion supported by the sample data and ME? | 1× per test |
Confidence level and sample size are the two dials that control the margin of error and they work in opposite ways.
A higher confidence level means a larger margin of error: you trade precision for certainty. 99% is more certain than 90%, but its interval is wider. The confidence level alone can't shrink ME without a cost.
The only way to reduce ME without lowering confidence is to increase n. Because n sits under a square root, halving ME requires quadrupling n: doubling the sample isn't enough.
Writing "the margin of error is 95%." The 95% is the confidence level; the ME is the ± value it produces.
Fix: state them separately: "at 95% confidence, ME = ±3 percentage points."
Computing z* × (σ/n) instead of z* × (σ/√n). With n in the hundreds, that's wildly off: √400 = 20, not 400.
Fix: write √n explicitly; calculate it first, then divide σ by that result.
"The poll proves support is 54%." Margin of error gives an estimated range, not proof.
Fix: use "consistent with the data" or "within the ± range": never "proves" or "exactly equals."
ME captures random sampling error only. Surveying one Orlando neighborhood is biased no matter how large n is.
Fix: ME ≠ accuracy. A large but biased sample still gives a biased estimate: a classic SAT trap.
Work each one, then reveal the answer. They run easy → medium → hard, like SAT Data Analysis.
A survey of 900 households reports a mean monthly spend of $2,400, with σ = 300. Find the margin of error at 95% confidence.
ME = 1.96 × (300 / √900) = 1.96 × (300/30) = 1.96 × 10 = $19.60.
Interval: $2,380.40 to $2,419.60.
A poll reports 47% ± 4% at 95% confidence. A commentator says the true support is "definitely below 50%." Is that claim supported?
Interval: 47% − 4% = 43% to 47% + 4% = 51%. Since the range reaches 51% (above 50%), the value is not necessarily below 50%: the claim is not supported.
Survey A uses n = 400 and reports ME = ±5%. Survey B uses n = 1,600 (same z* and σ). What is Survey B's margin of error?
Quadrupling n halves ME. √1600 / √400 = 40/20 = 2, so ME_B = 5% ÷ 2 = ±2.5%.
The margin of error is a measure of uncertainty in a sample result. It tells you how far the true population value might differ from the sample's estimate, expressed as ± a value (for example, "52% ± 3%"). It's calculated with ME = z* × (σ/√n), where z* is the confidence-level critical value, σ is the standard deviation, and n is the sample size. It appears in Florida's MAFS.912.S-IC inference standards and on the SAT Math section.
ME = z* × (σ / √n). The three variables are z* (critical value: 1.645 for 90%, 1.96 for 95%, 2.576 for 99%), σ (population standard deviation), and n (sample size). A larger sample reduces the margin of error because n appears under a square root. On the SAT, margin-of-error questions almost always use 95% confidence, so z* = 1.96.
As sample size (n) increases, margin of error decreases. To cut the margin of error in half, you must quadruple the sample size: because n appears under a square root. For example, n = 400 giving ME = ±5% means n = 1,600 gives ME = ±2.5%. This inverse-square-root relationship is a common SAT Data & Statistics question and an AP Statistics concept aligned with Florida's MAFS.912.S-IC standards.
Under Problem Solving & Data Analysis: typically 2–4 questions per test. Common types: interpreting what the ± value means in context, determining whether a stated value is consistent with a reported interval, identifying how changing sample size affects ME, and evaluating whether a conclusion is supported by the data. The essential skill is calculating the interval (sample result ± ME) and reasoning about values inside or outside it.
Yes: our certified Orlando math tutors specialize in SAT Math Data & Statistics: margin of error, confidence intervals, sample-size reasoning, and the specific SAT question types. We also support AP Statistics students working with Florida's MAFS.912.S-IC standards. We diagnose exactly where your student is losing points before building a targeted plan. Book a free math assessment to get started.
Margin of error is one of the most teachable SAT stats topics. Book a free math assessment and get a personalized Digital SAT plan built around your gaps.